Eye Color by U.S. State: Data From 235 Million Licenses
Brown, blue, green, hazel and gray eyes in 31 U.S. states, from the largest U.S. eye color dataset, plus what the numbers can't tell you.
Eye Color Rarity Editorial Team
Research & Data
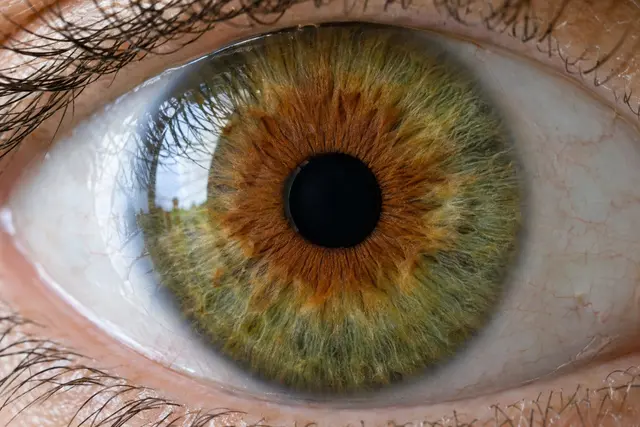
Brown is the most common eye color in 28 of the 31 states with data, and blue leads in the other three: South Dakota, Maine and Wyoming. These figures come from a 2025 study in PLOS ONE that collected eye color records from state motor vehicle departments. It covers 235,423,085 driver's licenses, which makes it the largest study of eye color in the United States.
We have put all 31 states in one table below, then pulled out what stands out. Keep one thing in mind as you read: these are colors people chose for themselves at the DMV, not clinical measurements. You can also pick your state in our rarity tool and compare any two colors there.
Eye color percentages for all 31 states
| State | Brown/black | Blue | Hazel | Green | Gray | Other |
|---|---|---|---|---|---|---|
| Alaska | 44.3% | 30.5% | 13.6% | 10.9% | 0.6% | 0% |
| Arizona* | 37.5% | 17.1% | 8.5% | 7% | 0.4% | 29.5% |
| California* | 61% | 15.3% | 7.5% | 7% | 0.6% | 8.6% |
| Connecticut | 57% | 22.8% | 11.3% | 7.9% | 0.5% | 0.5% |
| Delaware | 53.9% | 25.1% | 12.6% | 7.8% | 0.5% | 0% |
| Georgia | 58.5% | 21.6% | 8.9% | 10.4% | 0.6% | 0% |
| Idaho | 36.1% | 35.8% | 15.9% | 11.4% | 0.8% | 0% |
| Illinois | 58.7% | 22.6% | 9.2% | 8.7% | 0.6% | 0% |
| Indiana | 44.5% | 32% | 11.9% | 10.7% | 0.9% | 0% |
| Kansas | 43.7% | 31.6% | 13.3% | 10.6% | 0.8% | 0% |
| Kentucky | 39.9% | 32.9% | 11.9% | 13.4% | 0.8% | 1.1% |
| Maine | 34.9% | 37.7% | 18.5% | 8.3% | 0.5% | 0% |
| Michigan | 46.4% | 29.6% | 14.2% | 9.4% | 0.5% | 0% |
| Minnesota | 39% | 36.8% | 12.4% | 11% | 0.7% | 0.1% |
| Missouri | 41.3% | 32.3% | 12.8% | 12.9% | 0.7% | 0% |
| Nebraska | 37.6% | 35.3% | 12.5% | 14% | 0.5% | 0% |
| New Hampshire | 39.4% | 34.1% | 16.9% | 9.1% | 0.5% | 0% |
| New York | 63.4% | 19.6% | 9.4% | 6.9% | 0.7% | 0% |
| North Carolina | 55.4% | 23.5% | 11.2% | 9.5% | 0.4% | 0% |
| Ohio | 46.5% | 30% | 11.6% | 11.4% | 0.6% | 0% |
| Oregon | 43.7% | 31.4% | 13.6% | 10.5% | 0.7% | 0% |
| Pennsylvania | 45.9% | 28.4% | 14.8% | 10.1% | 0.8% | 0.1% |
| South Dakota | 35.2% | 38% | 14.2% | 12% | 0.6% | 0% |
| Texas | 67.1% | 16.2% | 8% | 8.1% | 0.6% | 0% |
| Utah | 36.1% | 34.4% | 16.4% | 12.6% | 0.5% | 0% |
| Vermont | 36.7% | 36.5% | 16.9% | 9.1% | 0.8% | 0% |
| Virginia | 56.6% | 23.6% | 9.7% | 9.5% | 0.7% | 0% |
| Washington | 47.8% | 29.8% | 12% | 9.4% | 1.1% | 0% |
| West Virginia | 37.3% | 36.5% | 11% | 12.9% | 2.2% | 0% |
| Wisconsin | 40.7% | 35.1% | 11% | 11.7% | 1.2% | 0.4% |
| Wyoming | 34.3% | 35.6% | 16.8% | 12.7% | 0.6% | 0% |
| All 31 states | 53% | 23.7% | 10.3% | 9% | 0.7% | 3.3% |
*Arizona and California have large "other" groups, so their named colors run low. See the section on data problems below. Source: Table 1 of Hashem, Menicacci and Granet, 2025, using 2016 records.
Which states have the most blue eyes?
South Dakota leads at 38%, and it is one of only three states where blue beats brown. Maine (37.7% blue, 34.9% brown) and Wyoming (35.6% blue, 34.3% brown) are the others. Blue is also within a point of brown in Vermont, Idaho and West Virginia.
The study's authors point to demographics. Maine, Wyoming and South Dakota have white populations of 96%, 94% and 88%, compared with about 78% nationally for people 16 and over. Blue eyes come almost entirely from one European-linked variant, so that pattern is what you would expect.
Which states have the most brown eyes?
Texas tops the list at 67.1%, followed by New York at 63.4% and California at 61%. These are large, diverse states, with big Hispanic, Black and Asian populations. Illinois, Georgia and Connecticut are all close to 58%.
The national figure of 53% leans on these big states, because each license counts once. Texas, California and New York alone hold about 92 million of the 235 million records. Several large states are missing altogether, including Florida and New Jersey.
Where are green and hazel eyes most common?
Green peaks in Nebraska at 14% and Kentucky at 13.4%. Hazel peaks in Maine at 18.5%. New England is notable for hazel, with Vermont and New Hampshire both at 16.9%, while Wyoming and Utah are also high. The lowest hazel shares are in California (7.5%) and Texas (8%).
Green beats hazel in seven states, against the national pattern: Nebraska, Kentucky, West Virginia, Georgia, Wisconsin, Missouri and Texas. Missouri and Texas are basically ties. The authors raise the possibility that people in some places simply prefer the word "green". We think that is likely part of it, since the line between the two colors is hard to draw.
Why does West Virginia have so many gray eyes?
We don't know, and it may be a quirk of the form. West Virginia reports 2.2% gray, about three times the national 0.7%. Only Wisconsin (1.2%) and Washington (1.1%) also pass 1%.
A difference that sharp, in one state, could reflect how the form or the staff present the options as much as it reflects biology. Neighboring Kentucky and Pennsylvania are both at 0.8%. The study doesn't address this, so treat it as an open question. For more on the color itself, see our gray eyes profile.
What's wrong with the data?
The dataset is large, but it has real limits. The biggest one is easy to miss in the headline numbers.
Two states hold nearly all of "other"
The national "other" figure of 3.3% looks like a real category. But 7.7 million of its 7.8 million records come from Arizona and California. In Arizona, 29.5% of licenses fall into "other", which almost certainly means missing or unrecorded data and not unusual eyes. Their percentages for named colors run low as a result, so don't compare Arizona directly with other states.
Only 31 states took part
Eight states did not reply. Five said they don't record eye color: Florida, Maryland, Massachusetts, North Dakota and South Carolina. Six replied without providing data. Missing states include some of the most populous and diverse in the country, so the national totals are not a true national sample.
Everyone described themselves
Nobody checked these eyes. A driver chooses a color, and the choice depends on the options on that state's form. Hazel is the best example. It is 10.3% here and 18% in the 2014 Harris Poll.
The data is from 2016, and only covers drivers
People under 16 and people without a license are not included. Those who moved may hold licenses in two states. The authors call for standardized, clinician-recorded data, which would be better, but doesn't exist yet.
With those limits in mind, this is still the best picture of American eye color we have. If you want to see how these numbers feed into our national estimates, read the methodology.